Frontline Blog
City-level Data on COVID-19 Inequities
May 2022

New Paper Describes Formation of COVID-19 Health Inequities Dashboard
Big cities in the U.S. were hit first and hardest by COVID-19. As densely populated travel hubs, these urban areas are especially vulnerable to disease transmission, while high levels of racial and socioeconomic inequity in big cities further exacerbate the issue. At the same time, big cities have also provided innovative leadership on how to mitigate the pandemic’s effects.
Understanding the full impact of COVID-19 on big cities from an equity perspective has proven difficult, because we have surprisingly little accessible, comparable data available at the neighborhood or city level.
The dashboard provides key data on COVID-19 inequities and illustrates how social and economic factors can affect health and health equity in urban areas of the United States, allowing local governments to benchmark inequities in their jurisdiction as compared with peer areas in the nation.
A new paper published in the American Journal of Public Health describes how Drexel University’s Urban Health Collaborative and the Big Cities Health Coalition collaborated to develop the COVID-19 Health Inequities in Cities Dashboard, originally launched in January 2021. The Robert Wood Johnson Foundation provided funding to develop the dashboard. The article’s co-authors include BCHC executive director Chrissie Juliano.
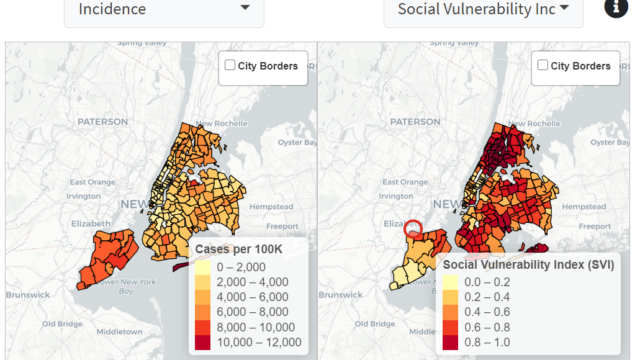
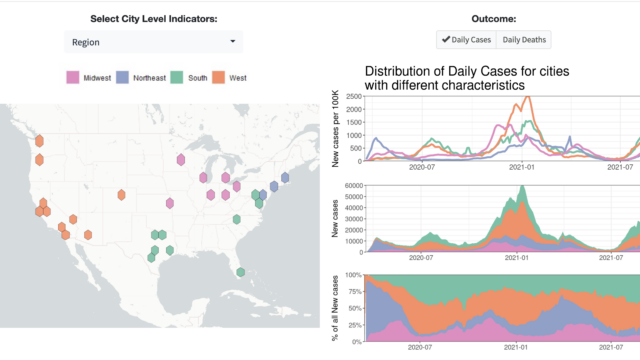
To demonstrate potential uses for the dashboard, the paper shows how the dashboard can be used to study inequities at three levels: across social groups, neighborhoods, and cities. The article also provides further information about how Drexel and BCHC carefully defined geographic areas to make data as comparable as possible between cities and some of the challenges they encountered in collecting and systematizing data.
The dashboard “provides key data on COVID-19 inequities and illustrates how social and economic factors can affect health and health equity in urban areas of the United States, allowing local governments to benchmark inequities in their jurisdiction as compared with peer areas in the nation,” the paper’s authors concluded. “More generally, it illustrates the value of comparing cities to each other as we work to identify policies to reduce urban health inequities. However, our experience also highlighted the many challenges inherent in developing useful and valid metrics that can be compared across cities. Addressing these challenges is critical to fully leveraging the power of city comparisons to promote health equity and urban health.”

Health Inequities in Cities Dashboard
Use this powerful data tool to enable visualizations of COVID-19 related outcomes and inequities across big cities.
Visit the Dashboard